


[Previous entry: "End of semester"]
[Next entry: "Gra Graph Graphics"]
01.19.2006: "Graphics Library Expansion"
Over winter break I looked at the NPlot graphing library in-depth to find a way to render buses with some existing construct. Bar plots were a natural choice and after a lot of work and learning I was able to produce bar graphs stacked on each other to look like a data bus. This screen shot illustrates the idea: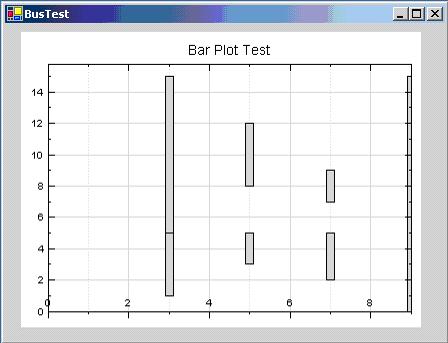
However, there was no way to taper the edges to give it a data bus look and the robust data handling of the bar plot library almost made it impossible to modify it to suit my purposes.
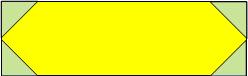
So, my new approach is to draw a rectangle and draw four triangles on the edges to mask off the edges of the rectangle and produce a tapering effect. Since NPlot does not have an inbuilt construct for triangles, I will have to develop a data bus unit from a rectangle and triangles that I write code for. The concept is illustrated in the following image: