Active Suspension System Test Platform
Bradley University
Department of
Electrical & Computer Engineering
By:
Craig Chan & Olusegun M. Abidoye
Advisor:
Steven Gutschlag
May 8, 2005
TABLE OF CONTENTS
Introduction……………………………………………………………………..Pg 1
Overview………………………………………………………………………..Pg 2
Control Feedback System Diagram…………………………………....………..Pg 3
Modes of Operation…………………………………...………………………...Pg 3
Inputs and Outputs………………………………………………………………Pg 4
Software Subsystem…………………………………..…………………………Pg 5
Setup Module……………………………………………………………Pg 6
Main Module…………………………………………………………….Pg 7
Keypad Module………………………………………………………….Pg 8
Kpad Subroutine…………………………………………………Pg 9
LCD Module……………………………………………………………..Pg 10
Charout1 Subroutine……………………………………………..Pg 11
Timer 2 Module………………………………………………….……….Pg 12
EX4 & EX5 Interrupt Handlers…………………………………..Pg 13
PWM Subroutine…………………………………………………Pg 14
A/D Module………………………………………………………………Pg 15
Control Block Diagram…………………………………………...Pg 16
Hardware Subsystem……………………………………………………………..Pg 18
Hardware Configuration………………………………………………….Pg 19
Phototransistor Optocoupler……………………………………………...Pg 20
High and Low Side Driver Configuration………………………………..Pg 21
Power MOSFET………………………………………………………….Pg 21
Test Platform Subsystem…………………………………………………………Pg 22
Screw Jack Specifications………………………………………………………...Pg 22
Test Results……………………………………………………………………….Pg 23
Parts List……………………………………………………...…………………..Pg 27
Work Schedule……………………………………………………………………Pg 27
Introduction:
The Active Suspension Test Platform project, figure 1-1, will include the following;
· A test bed
· A linear actuator
· Power electronics
· A micro-controller based feedback control system
· A user interface consisting of a keypad and a liquid crystal display
· An external interface which will allow the platform motion to be controlled by a waveform generator.
The Active Suspension Test Platform System will provide sinusoidal, triangular, and square wave inputs to active suspension systems mounted on its platform. The system will be utilized as a test platform for future Bradley University ECE department active suspension projects.

Figure 1-1 Overall System Block Diagram
Overview:
As shown in figure 1-1, the user will be able to specify the platform motion via the EMAC Micropac 535 micro-controller keypad or an optional external analog input signal. Once the desired platform motion has been selected, the test platform will move as specified, and the actual platform motion (e.g. frequency, amplitude) will be shown on the LCD display. Within the limits imposed by the actuator’s drive capabilities, the platform must move according to the desired input regardless of the load applied on the platform. The linear actuator, which will be used for preliminary design work, is shown in figure 2-1. A plate will be mounted to the top of the linear actuator to move the load in a vertical motion for initial experimental work. After the linear actuator has been successfully tested D.C motor with the following ratings would be used;
· 115 volts
· 3.4 amps
· 1/3 horsepower
· 1725 rpm
· Max ambient temperature 40 degrees Celsius

Figure 2-1. DC Electrak Mini Linear Actuator
Control Feedback System Diagram:

Figure: 3-1. System Feedback Diagram
The control feedback system block diagram in figure 3-1 shows the desired input signal from a function generator. That signal is then sent to the microcontroller for processing. The microcontroller then sends that signal to the power electronics which in turn drives the linear actuator located on the test platform. The feedback signal from the linear actuator is sent back to the microcontroller to adjust the position of the linear actuator.
Modes of Operation:
The user would be able to choose a desired platform motion, and this includes:
- Sinusoidal
- Step
- Triangular
Also, the user has the opportunity to select the desired frequency and amplitude of the platform’s motion, but will be based on the current software timing and selected hardware. The system would control the platform’s position correctly, regardless of the load placed on the platform.
Inputs and Outputs:
System
|
INPUTS |
OUTPUTS |
|
Desired platform motion |
Platform movement |
EMAC Micropac 535 micro-controller
|
INPUTS |
OUTPUTS |
|
Keypad |
Platform movement |
|
Waveform Generator |
LCD Display |
Actuator
|
INPUTS |
OUTPUTS |
|
Error signal from controller |
Platform movement |
Software Subsystem:
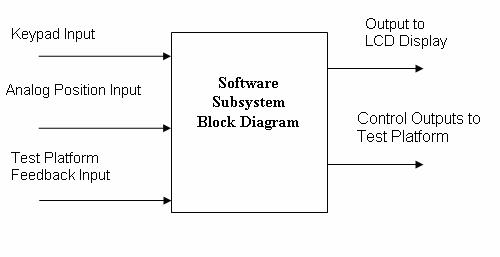
Figure 5-1 Software Subsystem Block Diagram
The software subsystem, figure 5-1, contains the micropac 535 microcontroller. The software subsystem accepts inputs from the keypad, optional analog position input (waveform generator), and feedback from the test platform. The user will be able to control the parameters of the test platform via the keypad. The parameters are frequency, amplitude, and waveform type. Instead of using software, the analog input provides the other option to specify the position inputs to control the platform. After the software subsystem processes the inputs from the keypad, it will then collect the feedback signal from the platform to obtain the current platform position. The software then generates an output from the two inputs it has acquired and then sends the control output to the power electronics to generate the desired platform motion. In addition, the software subsystem will use the LCD module to display necessary information for user verification and confirmation of the desired mode of operation. Below are software flowcharts used for the active suspension system test platform project.
Setup Module

Figure 6-1 Setup Module flowchart
The figure above is my setup program, which basically setups the EMAC development kit and makes it ready to be used as desired. It is the first module for the entire ASSTP (Active suspension system test platform) project, with a starting address of 8000h.
Main Module

Figure 7-1 Main Module flowchart
The above flowchart is the initial main program i am currently using. It maybe modified later, and changes will be indicated.
Keypad Module
When a user depresses a key, EX1 (external interrupt 1 ) generates. The EX! Handler is responsible for servicing this interrupt. It fetches the keys pressed via the Kpad subroutine and then translates each key to their corresponding ASCII equivalent. Next, each key performs the necessary task attributed to it. Currently, key 0 through 9 is available for the user to enter desired duty cycle, and key B is for correction purposes which could be thought of as the backspace button, and key E is for the user to confirm entries, the enter button.

Figure 8-1. Keypad interrupt handler module
This is responsible for the processing of all keys pressed on the keypad. It calls other subroutines to accomplish this, and the returns from interrupt. Flowcharts of other modules it utilizes are below.

Figure 9-1. Kpad subroutine module.
This is another keypad subroutine that is utilized by the keypad handler in figure 9-1 above. This software is responsible for fetching keys pressed on the keypad and decoding what keys are pressed, for later processing.
LCD Module
The LCD module prompts user for platform parameters and also displays on the lcd user entries, just for visual aid. It utilizes the following flowcharts below;

Figure 10-1 Display module

Figure 11-1 Charaout1 subroutine
Figure 10-1 and figure 11-1 above work hand in hand together. They can be utilized anytime to display an actual message string on the LCD module. The display module in figure 1 above achieves this be calling the charout1 subroutine for every letter it sees and then quits when it encounters a zero at the end of the string which indicates end of data string.
Timer 2 Module
Timer 2 module basically generates the PWM signals necessary to drive the power electronics to control the platform bi-directionally. Timer 2 of the microcontroller, is configured in auto-reload mode 0, and compare mode 1, which allows us to use all 16 bits of timer 2 registers. It generates two PWM signals, forward and reverse by utilizing EX4 (external interrupt 4), EX5 (external interrupt 5), and timer 2 overflow interrupt. The two PWM signals are being generated at P4.1 and P4.2 of the microcontroller. EX4 occurs when the contents of CC1 (compare capture register 1) register of timer 2 is equal to timer 2 registers, and EX5 occurs when the contents of CC2 (compare capture register 2) register of timer 2 is equal to the timer 2 registers. The timer 2 interrupt occurs when timer 2 overflows. Below are the software flowcharts being utilized by this module.

Figure 12-1 Timer 2 Module flowchart
The flowchart above is for timer 2 interrupt handler. It clears all ports while EX4 handler sets one of the ports P4.1 and clears P4.2 and EX5 interrupt handler sets the other port P4.2 and clears P4.1.


Figures 13-1, 2 EX4 and EX5 interrupt handler flowcharts
Figure 13-1, 2 are the software flow charts for EX4 and EX5 interrupt handler. The PWM signals are generated by setting and clearing of P4.1 and P4.2 at regular intervals, one at a time.

Figure 14-1 PWM subroutine flowchart
Figure 14-1 above is the PWM subroutine software flowchart. As shown in the flowchart, it determines which of the PWM signals to generate based on the status the direction flag. If the direction flag is cleared, the forward PWM is generated, and if the direction flag is set, the reverse PWM signal is generated. The status of the direction flag will be determined by the A/D module which is responsible for the feedback signal coming from the actuator.
A/D Module
The A/D module sets or clears the direction flag based two different signals coming into the microcontroller, via two different A/D channels. The input signal is coming in from channel 0 of the A/D converter, and the feedback signal is coming in from channel 2 of the A/D converter.

Figure 15 – 1. A/D Module flowchart
Figure 16-1 is the software flowchart responsible for getting the signals into the microcontroller.

Figure 16 – 1. Control block diagram
Figure 16 – 1 is the control block diagram implemented in software. A proportional controller was implemented based on the error signal coming into the microcontroller. The duty cycle of the PWM signal is adjusted accordingly in order to drive the power electronics as necessary, to ensure a platform output motion that follows the input voltage signal being applied to the system.
The control algorithm for adjusting the duty cycle as well as the direction of the PWM signal was implemented in the suspension module.
n DC_new = DC_old + K * Pe
n Pe = Pi – Pa (Pi > Pa, clr dir flag, forward PWM)
n DC_new = DC_old – K *Pe
n Pe = Pa – Pi (Pa > Pi, setb dir flag, reverse PWM)
Where,
DC_new = duty cycle new
DC_old = duty cycle old
Pi = input signal
Pa = Actuator position feedback signal
Pe = error signal
K = Constant multiplier
When Pi is greater than Pa, the error signal is the input signal minus the actuator position. This implies that a forward PWM signal, and the direction flag is cleared. The value is then multiplied by a gain in software and added to the previous duty cycle computed. When the Actuator position is greater than the input signal, which implies a reverse PWM, the direction flag is set. The error signal is computed by subtracting the input signal from the actuator position. This value again is multiplied by the same constant and then subtracted from the previous duty cycle computed. This is the recursive equation implemented preliminary in software.
Hardware Subsystem:

Figure 18-1 Hardware Subsystem Block Diagram
The hardware subsystem, figure 18-1, contains all of the power electronics that drive the test platform. The bulk of the power electronics will consist of an H-bridge to control the direction of the test platform. The H-bridge will be designed to drive a 115 [volt] DC motor. The hardware subsystem will also contain optical isolators which will be implemented to interface the microcontroller with the power electronics.
Hardware Configuration

Figure 19-1 Hardware Configuration Diagram
The hardware configuration above shows the microcontroller, photo transistors, high and low side drivers, power MOSFETs, and the H-bridge configuration. The microcontroller sends two signals to the phototransistors. Then, the signal is passed on to the high and low side drivers which turn on and off the power MOSFETs. Depending on which set of power MOSFETs are on, will determine which direction the motor is moving.
Phototransistor Optocoupler

Figure 20-1 Phototransistor Optocoupler Diagram
The phototransistor optocouplers are used to isolate the microcontroller from the power electronics. This will prevent any reverse voltage that might cause harm to the microcontroller.
High & Low Side Driver Configuration

Figure 21-1 High and Low Side Driver Diagram
The figure above is the high and low side driver configuration. The high and low side driver is used to turn on and off two power MOSFETs.
Power MOSFETS

Figure 21-2 Power MOSFET Diagram
The figure above is a power MOSFET. This particular MOSFET has a gate to source voltage of 200 volts. For our project we will only be using a max of approximately 115 volts.
Test Platform Subsystem:

Figure 22-1 Test Platform Subsystem Block Diagram
The input signal from the hardware will be applied to the platform, as shown in
figure 22-1. The platform will then generate the actual platform motion and generate a feedback signal that will be fed back into the microcontroller for further processing.
Screw Jack Specifications
n 18 Inches of Stroke Length
n Gear Ratio 5:1
n Turns of worm per inch travel = 10
n Max Horse Power 1/3
n Max load = 1000 Lbs
n Max worm speed at rated load = 868 RPM
n Max load at 1750 RPM = 496 lbs
n Assembled with a top plate
Preliminary Experimental Results
The preliminary experimental results were obtained using the electrak mini actuator.

Figure 23 – 1 Step response
Figure 23 – 1 above is the scope plot of a continuous step response obtained in laboratory. This is a preliminary result because the software has not been fully developed. Until accurate and detailed system identification is done, the appropriate gain value to stabilize the system would not be obtained. An input signal of about 340 [mHz] was applied to the system, and as shown in figure 23 – 1 above, the actuator position feedback signal is tracking the input signal being applied.
Figure 24 – 1 below is the scope plot with a sinusoidal input obtained in laboratory. A sine wave with a frequency of 540 [mHz]. The actuator position feedback signal lags the input signal with a phase of about 14.81 degrees. This results where obtained with a 15[lbs] load on the platform of the actuator.

Figure 24 – 1. Sinusoidal Input

Figure 24 – 2 Triangle Wave Input
Figure 24 – 2 above is the scope plot with a triangle wave input obtained in laboratory. The actuator position feedback signal tracks the input signal as closely as possible, even at a frequency of about 1 [Hz].This results where obtained with a 15[lbs] load on the platform of the actuator.
Final Experimental Results
The final control algorithm implemented in software was
DC_new = K * Pe
The following plots were obtained with K = 1
Notice in figure 26 – 1 below, no overshoot in the system, which is the kind of response we expected. With a K = 10, figure 26 – 2 was obtained, and as shown there is overshoot in the system.

Figure 25 – 1 Sinusoidal Input, K = 1

Figure 26 – 1 Step response, K = 1

Figure 26 – 2 Step response, K = 10
Parts List
· Micropac 535
· IR2213 High and Low Side Driver
· 4N25 Phototransistor
· Linear Actuator
· DC Motor
· IRF640N N-Channel Power Mosfets
Work Schedule
Fall Semester
· ASSTP Project Research
· Power Electronics Design
Spring Semester
· Week 1-2 Software Design
· Week 3-4 Software Coding
· Week 5-7 Software Debugging and Testing
· Week 8-10 System Integration of Hardware and Software Subsystems
· Week 11- Research on project expansion and senior presentation preparation