[Main] [Project Deliverables ] [Progress Log] [Methods/Research ] [References/Links]
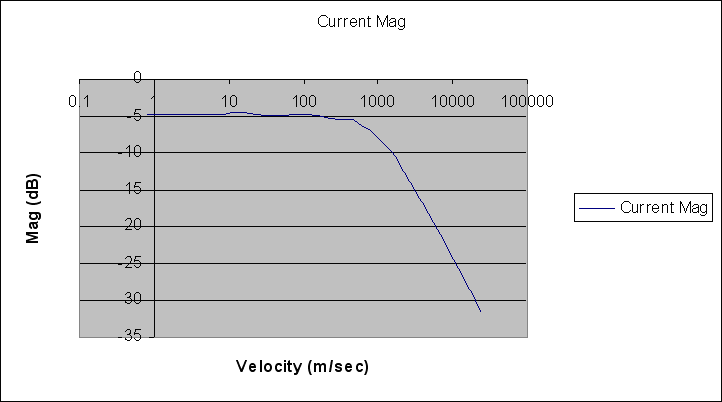
The frequency response of the track was taken with added resistance in series to allow for larger voltage measurements. The magnitude and phase responses were as predicted using control theory. Figure 1 shows the plot of the results.
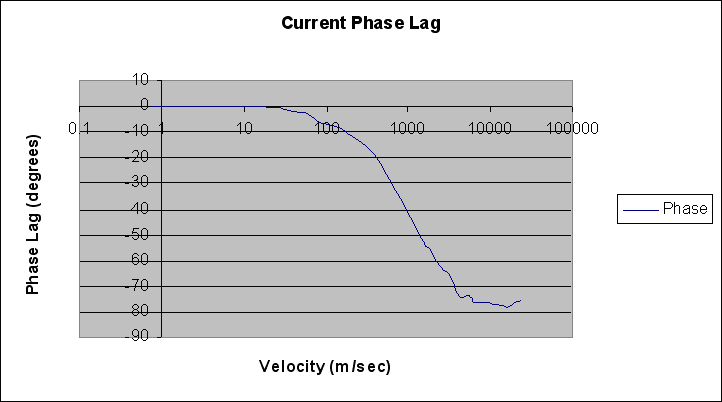
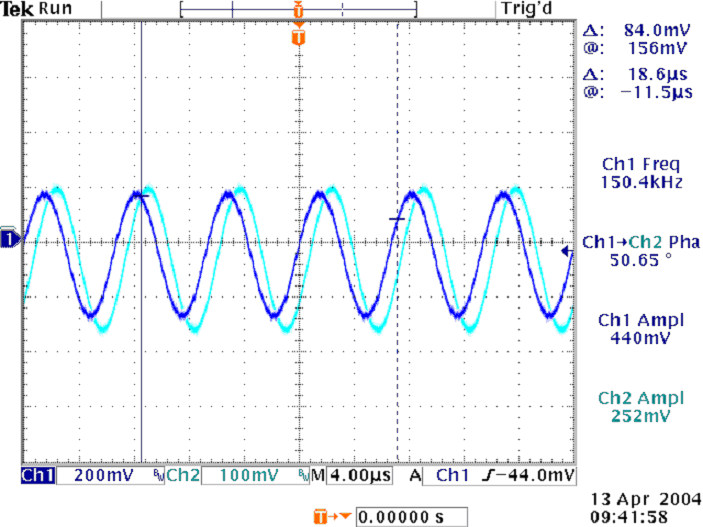
The time domain plot to illustrate the phase shift at a given frequency is shown in figure 2.
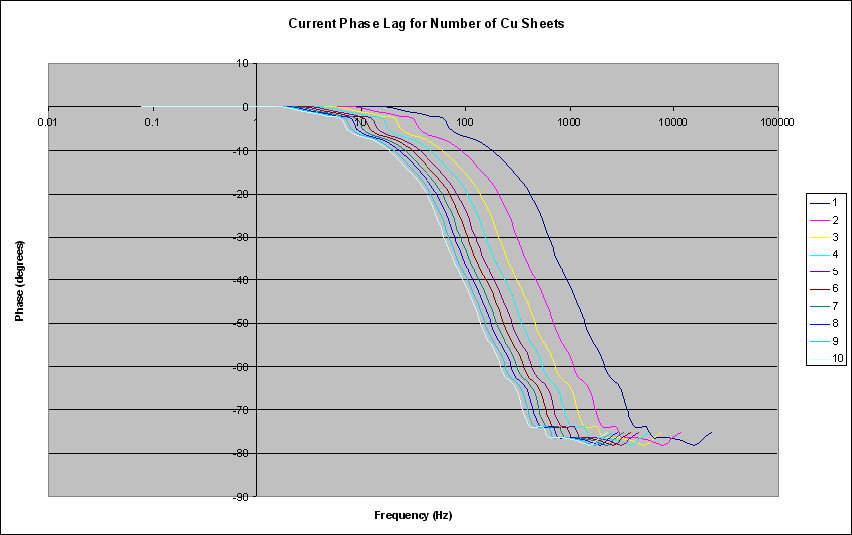
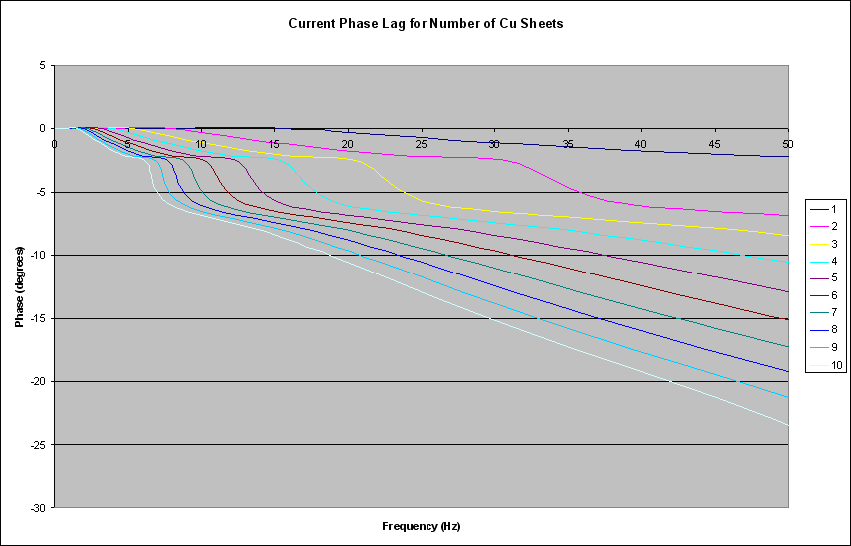
Laminating more sheets of copper allows for the resistance to go in parallel. This allows for the phase shift to occur at lower frequencies. Figure 3 shows the phase response for each number of laminated sheets.
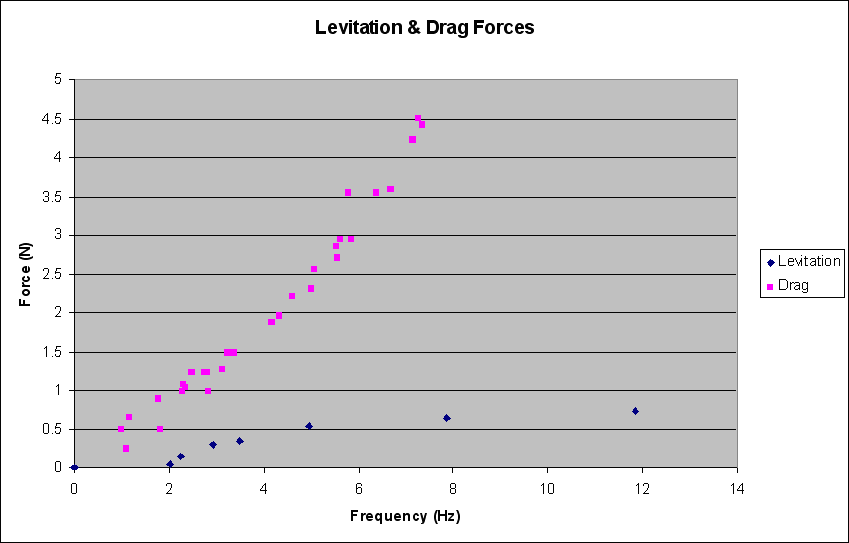
Using the Maglev Test Bench, the drag forces and levitation forces have been found. Figure 4 shows the force data found.